How to Choose an MBBR Wastewater Treatment System in 2026
Choosing an MBBR system in 2026 starts with the wastewater, not the equipment brochure. Flow rates, temperature, organic load, ammonia levels, and discharge targets shape the design. A municipal plant facing morning flow peaks has different needs from a food-processing facility with variable washdown water.
The scale of the challenge is clear. UNESCO’s 2017 World Water Development Report, Wastewater: The Untapped Resource, estimated that about 80% of wastewater worldwide was discharged without adequate treatment or reuse. That figure is global context, not a design target. Still, it highlights why treatment performance and reliable operation matter. A Mbbr System For Wastewater Treatment uses biofilm carriers suspended in an aerated tank, but its results depend on sound process design, pretreatment, and day-to-day control. Plastic media alone cannot fix poor screening or inconsistent oxygen delivery.
Look closely at the details. Compare guaranteed effluent limits, carrier fill fraction, blower energy, tank volume, and access for maintenance. Ask vendors to explain performance under peak loads, cold conditions, and expected influent variation. Request reference projects with similar wastewater, not just similar plant capacity. Check how screens protect carriers and how operators will monitor dissolved oxygen and biomass. Small details matter.
There is no universal best system. A compact footprint may help on a crowded site, while energy use or maintenance access may outweigh that advantage elsewhere. Treat supplier claims as starting points. Verify them against representative wastewater data and an independent engineering review. One limitation remains: early estimates can miss real-world variation. Measure, then refine.
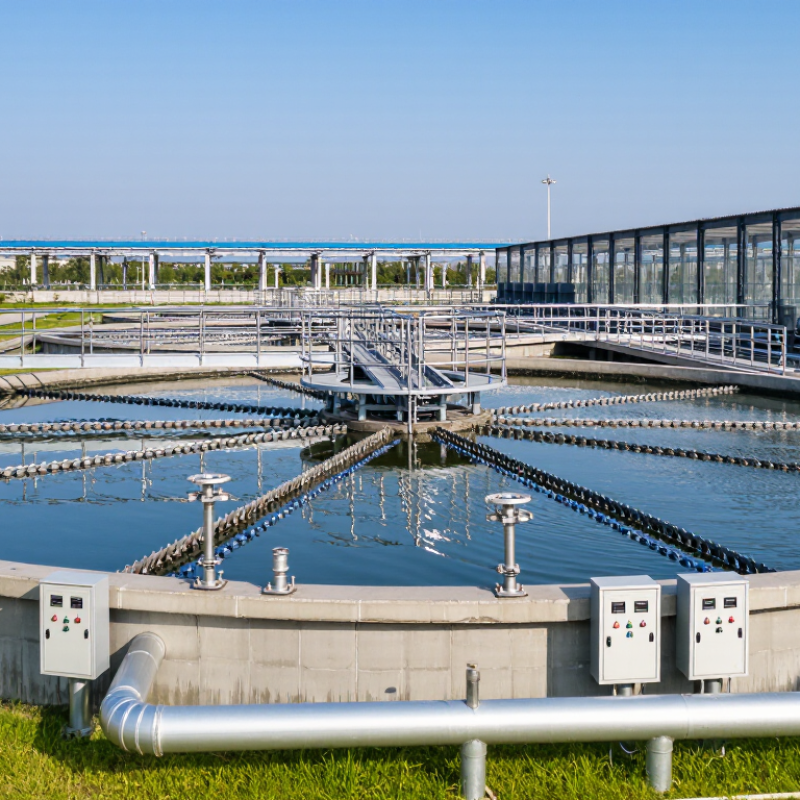
Define Influent Loads, Flow Variations, and Required Effluent Limits
How to Choose an MBBR Wastewater Treatment System in 2026
Define Influent Loads, Flow Variations, and Required Effluent Limits
Choosing an MBBR system starts with measured wastewater, not a brochure capacity. Record daily flow and test BOD, COD, suspended solids, ammonia, and temperature. Convert concentrations into mass loads using flow data. A modest average can hide a difficult peak. In practice, one grab sample is a clue, not a design basis.
Track hourly peaks, weekend lows, production changes, and seasonal shifts. Note sudden cleaning discharges or other process changes that could affect biology. These details help engineers estimate equalization needs, aeration demand, carrier-media quantity, and downstream solids separation. Small details matter. Where records are incomplete, state the uncertainty and collect more samples rather than treating estimates as facts. A spreadsheet can miss a short but important loading spike.
Set effluent targets from the applicable discharge requirements and the receiving system’s acceptance criteria. Identify limits for BOD, suspended solids, ammonia, or other regulated parameters, including any seasonal conditions. Then check that the proposed process train can meet those targets under expected peak loads, not just average conditions. Ask for design assumptions and performance data relevant to similar wastewater. The weakest assumption deserves another look.
Size Biofilm Capacity Using Media Surface Areas of About 500–1,200 m²/m³
For an MBBR system, treat 500–1,200 m²/m³ as a screening range for carrier surface area, not a guaranteed treatment capacity. Ask whether the supplier means total or protected area; only the surface available for stable biofilm should inform sizing. Ødegaard’s review of moving-bed biofilm technology in Water Science and Technology (2006) explains how carrier area and applied organic loading shape reactor performance. The U.S. EPA’s 2000 MBBR fact sheet also describes the process’s reliance on retained plastic media and attached growth. A large number alone proves little.
Check the design against actual wastewater data: daily flow, peak flow, temperature, BOD or ammonia load, and the discharge target. For example, a cold-weather nitrification design may need more effective area than a warm, carbon-removal stage. Request the assumed loading rate in grams per square metre per day, then verify it against pilot or operating data for similar wastewater. Look closely. Also confirm fill fraction, screen openings, and aeration capacity; carriers must move freely without escaping. One practical flaw: influent samples can miss short peak loads. Allow margin, but do not buy excess media as a substitute for sound load estimates.
How to Choose an MBBR Wastewater Treatment System in 2026 — Size Biofilm Capacity Using Media Surface Areas of About 500–1,200 m²/m³
The chart shows the stated reference range; 850 m²/m³ is its arithmetic midpoint, not a separate design standard. Compare media using the supplier’s documented surface-area basis, and size the system against wastewater flow, treatment targets, and process loading—not surface area alone.
Compare Carrier Fill Ratios Within the Common 30–70% Design Range
Carrier fill ratio describes the volume of biofilm carriers compared with the effective reactor volume. In many MBBR designs, the working range is about 30–70%. That range is a starting point, not a guarantee of treatment performance. A 40% fill may suit one tank, while another needs more carriers because its wastewater load or operating conditions differ.
At lower fill ratios, carriers have more room to circulate, which can support mixing and oxygen transfer. At higher ratios, more protected surface area is available for biofilm, but only if the aeration grid keeps carriers moving. Watch a transparent test vessel or inspect the reactor during operation: carriers should circulate across the tank, not collect in a quiet corner. Small details matter. Screens also need enough open area to retain carriers without becoming frequent cleaning points.
Avoid choosing 70% simply because it is the upper end of the common range. Dense media can increase resistance to movement, and extra surface area is not useful if oxygen delivery or mixing falls short. Check the carrier supplier’s recommended loading, tank geometry, diffuser layout, and peak-flow conditions. A modest fill increase may help, but it can also expose an undersized blower or uneven air distribution. Pilot testing is useful where wastewater strength changes seasonally. I would treat any single “ideal” percentage with caution; real operating data should guide the final setting.
Check Aeration and Mixing, Including a Typical Nitrification DO of ≥2 mg/L
When choosing an MBBR wastewater treatment system in 2026, check whether aeration supplies oxygen and keeps carriers moving.
The U.S. EPA’s Nutrient Control Design Manual (2010) uses about 2 mg/L dissolved oxygen as a common nitrification benchmark.
Treat it as a starting point, not a guarantee. Oxygen must reach the biofilm, while air must prevent carriers from settling or clumping. Watch carrier movement. Media collecting in corners can signal poor mixing, even when a probe reads 2 mg/L. No magic number.
The EPA’s Moving Bed Biofilm Reactor fact sheet (2000) describes aeration as supporting both oxygen transfer and media movement. Ask for airflow data at peak load, blower turndown capability, and evidence that carriers circulate throughout the tank.
During commissioning, compare dissolved oxygen readings at different depths and corners, then observe the media under normal operating conditions.
Keep in mind that cold water, higher ammonia loads, and fouled diffusers can change oxygen demand or delivery. A single clean probe may miss uneven conditions. I would question my own first reading, too.
Assess Screen Retention, Controls, Maintenance, and Whole-Life Operating Costs
How to Choose an MBBR Wastewater Treatment System in 2026
Screen retention deserves a field test, not just a drawing review. Confirm the outlet screen openings suit the selected carrier media, then test at peak flow. Look for media escape, clogging, and trapped debris. Small details matter. Ask operators how screens can be inspected and cleaned without disrupting treatment. Controls deserve the same scrutiny. Verify dissolved-oxygen sensors, blower speed control, alarms, and trend logs. Can staff spot a failing sensor before it drives excess aeration? The U.S. EPA’s 2013 Energy Efficiency in Water and Wastewater Facilities guide estimates that U.S. wastewater treatment uses about 30 billion kilowatt-hours of electricity each year. That makes control performance an operating-cost issue, not a software extra.
Compare whole-life costs over the same study period. Include electricity, routine screen cleaning, sensor calibration, replacement parts, labor, sludge handling, and planned downtime. Request the assumptions behind every estimate, including electricity rates and expected media life. A low purchase price can hide expensive maintenance. A detailed spreadsheet can still miss the messy reality of a blocked screen on a wet Monday. Ask for references from facilities with similar flows, and check whether their reported savings were measured or modeled. Actual results vary with wastewater strength, operator practices, and local energy prices.